Goal
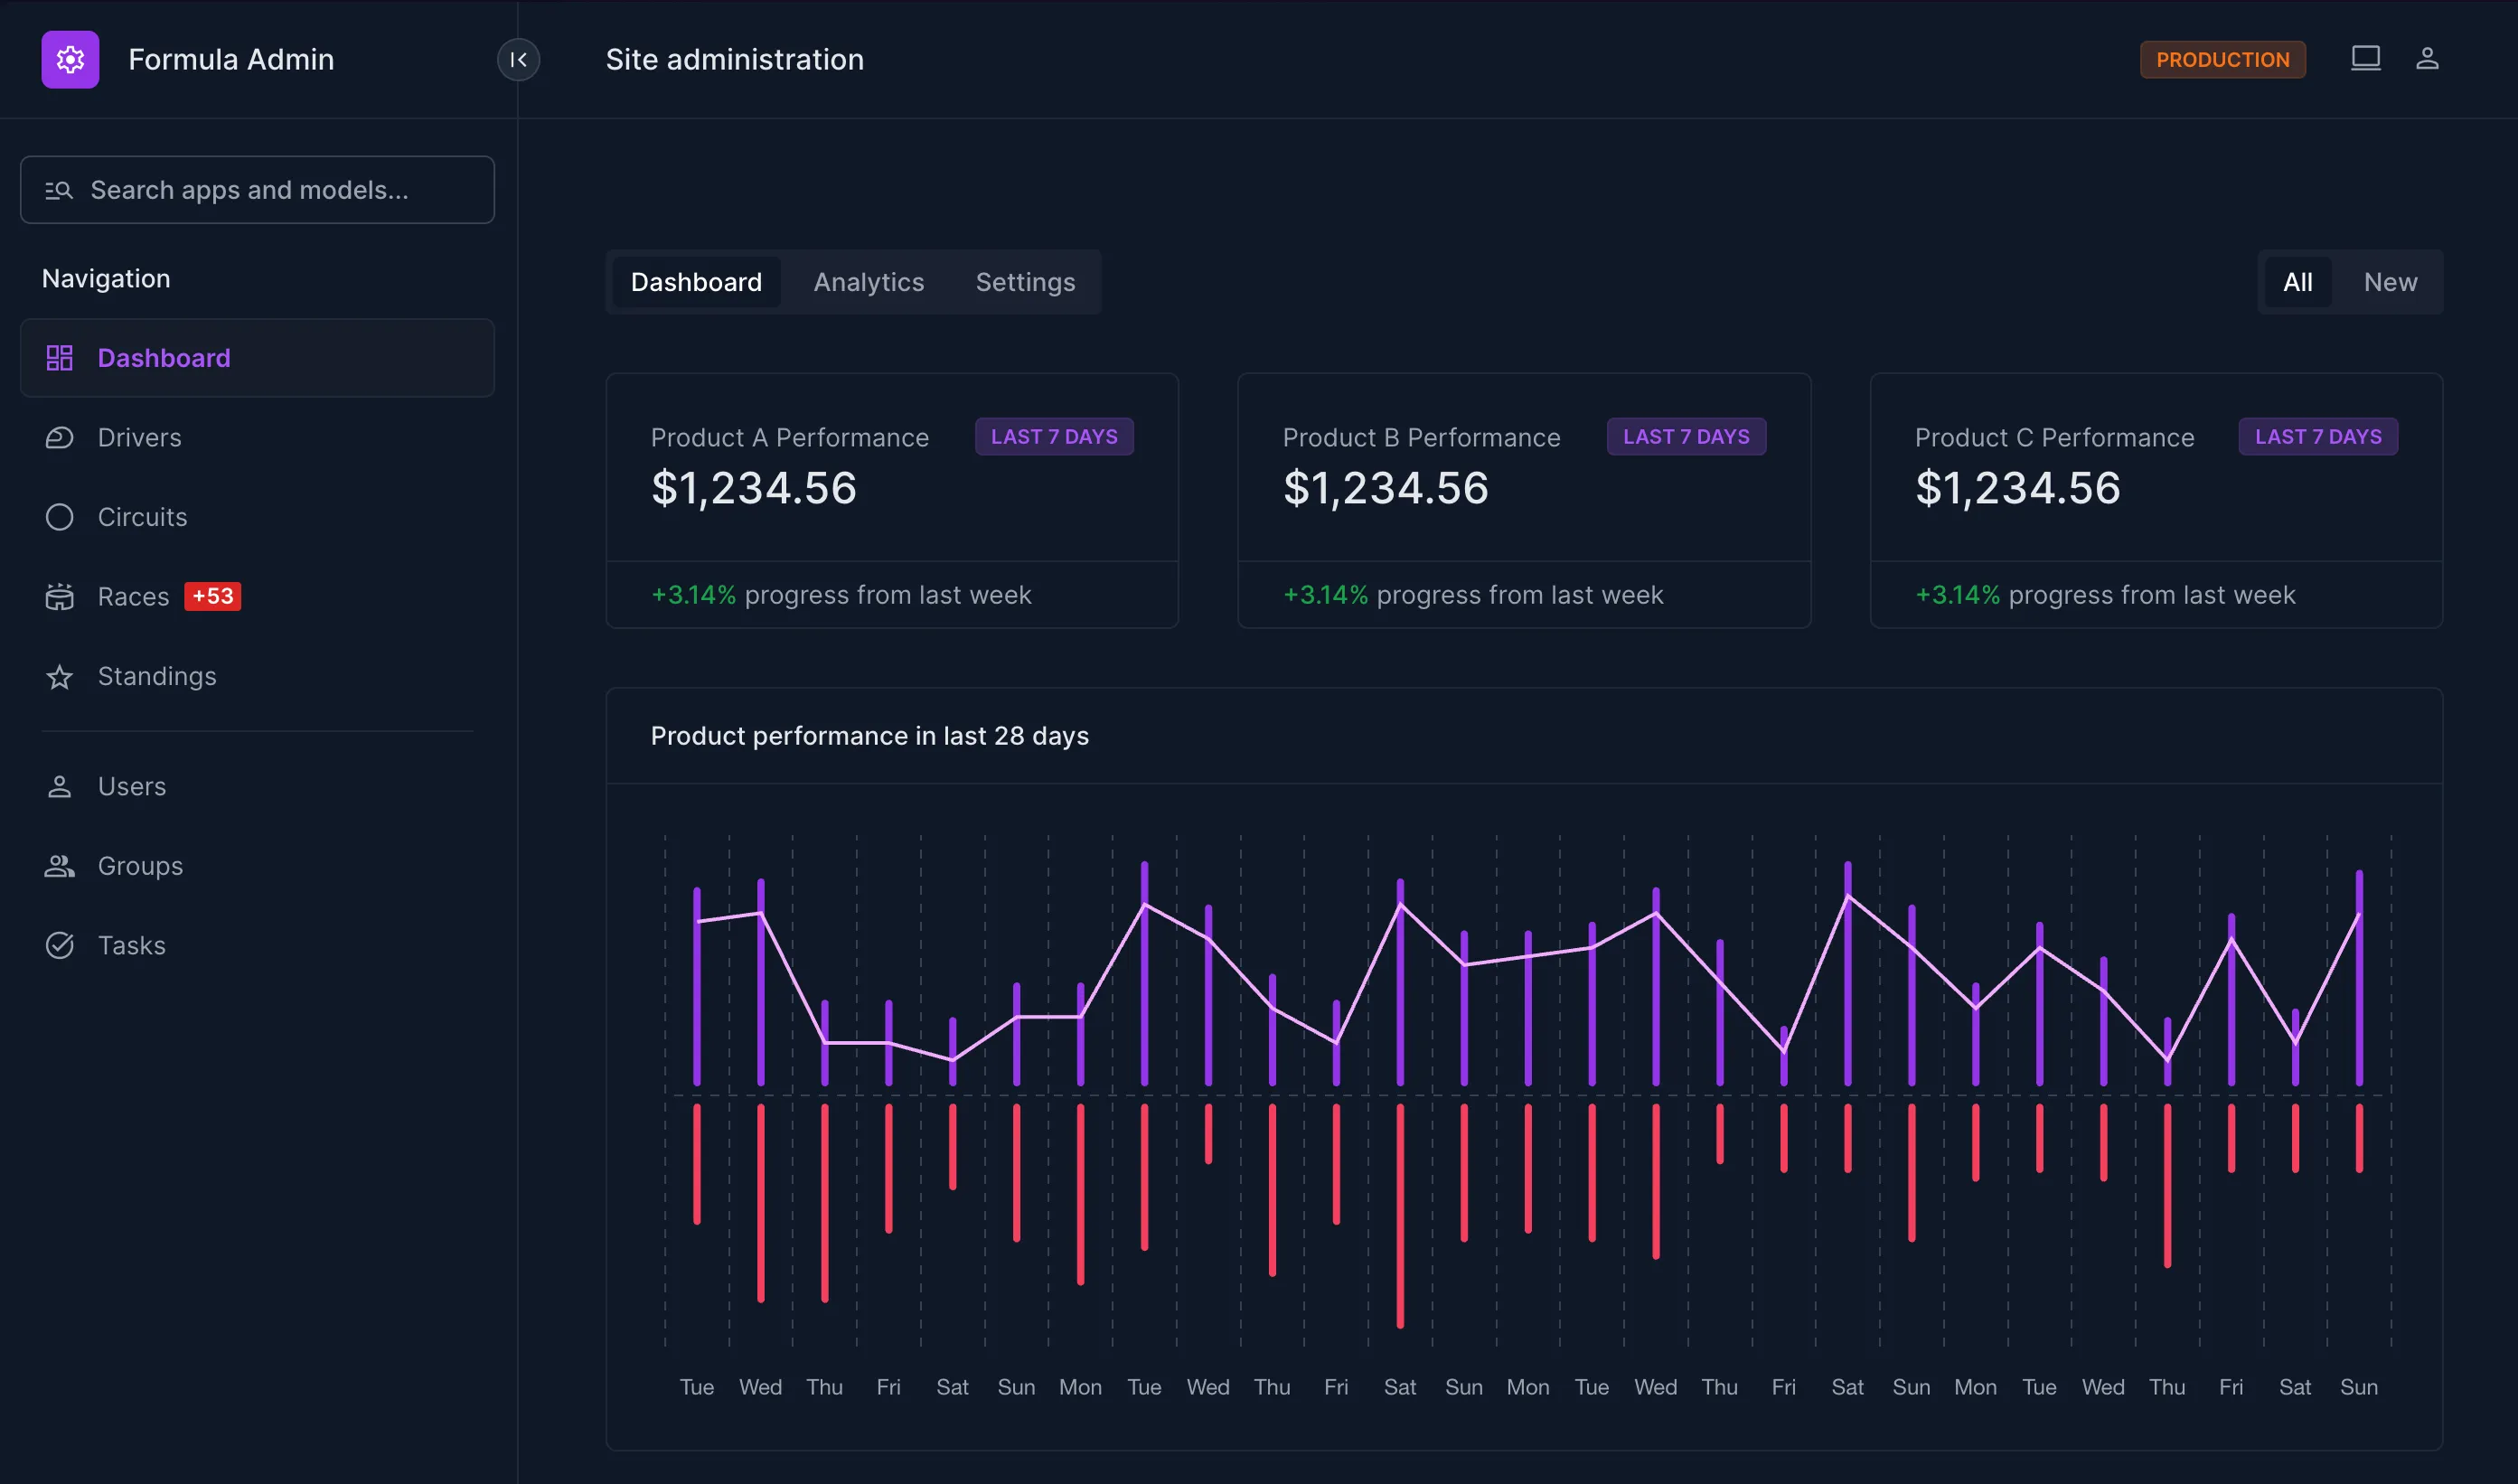
Setup a custom admin dashboard in an existing repo, using the templates provided by the Unfold Formula Demo project. https://demo.unfoldadmin.com/admin/
Prerequisites
Install and Setup Django Unfold Admin
Unfold - Admin theme for Django
Create Admin Dashboard App
This new app will house the views and styles we need for our new admin dashboard.
In your terminal run:
python manage.py startapp admin_dashboardUpdate INSTALLED_APPS, the new app should be added below the unfold apps.
INSTALLED_APPS = [ ... "admin_dashboard.apps.AdminDashboardConfig", ...]Setup Admin Index Template
Create File
In your Django project folder, create a new file at this path: templates/admin/index.html
Update Template Settings
Update your settings.py TEMPLATES to discover templates in this directory.
TEMPLATES = [ { "BACKEND": "django.template.backends.django.DjangoTemplates", **"DIRS": [BASE_DIR / "templates"],** "APP_DIRS": True, ... },]Fill in Template
Paste the following into your newly created templates/admin/index.html file :
{% extends 'unfold/layouts/base_simple.html' %}
{% load i18n unfold %}
{% block breadcrumbs %}{% endblock %}
{% block title %}    {% trans 'Dashboard' %} | {{ site_title|default:_('Django site admin') }}{% endblock %}
{% block branding %}    <h1 id="site-name">        <a href="{% url 'admin:index' %}">            {{ site_header }}        </a>    </h1>{% endblock %}
{% block content_before %}    {% component "unfold/components/header.html" %}        {% trans "Unfold Dashboard" %}    {% endcomponent %}{% endblock %}
{% block content %}    {% component "unfold/components/container.html" %}        {% component "unfold/components/flex.html" with class="gap-4"%}            {% component "unfold/components/navigation.html" with items=navigation %}{% endcomponent %}
            {% component "unfold/components/navigation.html" with class="ml-auto" items=filters %}{% endcomponent %}        {% endcomponent %}
        {% component "unfold/components/flex.html" with class="gap-8 mb-8 flex-col lg:flex-row" %}            {% for stats in kpi %}                {% trans "Last 7 days" as label %}                {% component "unfold/components/card.html" with class="lg:w-1/3" label=label footer=stats.footer %}                    {% component "unfold/components/text.html" %}                        {{ stats.title }}                    {% endcomponent %}
                    {% component "unfold/components/title.html" %}                        {{ stats.metric }}                    {% endcomponent %}                {% endcomponent %}            {% endfor %}        {% endcomponent %}
        {% trans "Product performance in last 28 days" as title %}        {% component "unfold/components/card.html" with class="mb-8" title=title %}            {% component "unfold/components/chart/bar.html" with data=chart height=320 %}{% endcomponent %}        {% endcomponent %}
        {% component "unfold/components/flex.html" with class="gap-8 mb-8 flex-col lg:flex-row" %}            {% trans "The most trending products in last 2 weeks" as title %}            {% component "unfold/components/card.html" with class="lg:w-1/2" title=title %}                {% component "unfold/components/card.html" %}                    {% component "unfold/components/title.html" with class="mb-2" %}                        $1,234,567.89                    {% endcomponent %}
                    {% component "unfold/components/text.html" %}                        {% blocktrans %}                            Total revenue between <span class="font-medium text-gray-700 dark:text-white">1 - 31 October</span>. Increase <span class="text-green-600 font-medium">+3.14%</span> comparing to previous month <span class="font-medium text-gray-700 dark:text-white">1 - 30 September</span>. <a href="#" class="text-primary-500 underline">View detailed analytics.</a>                        {% endblocktrans %}                    {% endcomponent %}                {% endcomponent %}                {% component "unfold/components/separator.html" %}{% endcomponent %}
                {% component "unfold/components/flex.html" with col=1 class="gap-8" %}                    {% for metric in progress %}                        {% component "unfold/components/progress.html" with title=metric.title description=metric.description value=metric.value %}{% endcomponent %}                    {% endfor %}                {% endcomponent %}            {% endcomponent %}
            {% component "unfold/components/flex.html" with class="gap-8 lg:w-1/2" col=1 %}                {% for stats in performance %}                    {% component "unfold/components/card.html" %}                        {% component "unfold/components/text.html" %}                            {{ stats.title }}                        {% endcomponent %}
                        {% component "unfold/components/title.html" with class="mb-8" %}                            {{ stats.metric }}                        {% endcomponent %}
                        {% component "unfold/components/chart/line.html" with data=stats.chart %}{% endcomponent %}                    {% endcomponent %}                {% endfor %}            {% endcomponent %}        {% endcomponent %}    {% endcomponent %}{% endblock %}
Tailwind CSS
Unfold uses Tailwind under the hood, since we’re creating a custom template, we need to compile the tailwind styles our self.
Setup Tailwind Config
In your root folder, create a new file tailwind.config.js
Paste the following contents, and replace <django_project_dir> with your project directory.
module.exports = { content: ["./<django_project_dir>/**/*.{html,py,js}"], media: false, darkMode: "class", theme: { extend: { colors: { primary: { 50: "rgb(var(--color-primary-100) / <alpha-value>)", 100: "rgb(var(--color-primary-100) / <alpha-value>)", 200: "rgb(var(--color-primary-200) / <alpha-value>)", 300: "rgb(var(--color-primary-300) / <alpha-value>)", 400: "rgb(var(--color-primary-400) / <alpha-value>)", 500: "rgb(var(--color-primary-500) / <alpha-value>)", 600: "rgb(var(--color-primary-600) / <alpha-value>)", 700: "rgb(var(--color-primary-700) / <alpha-value>)", 800: "rgb(var(--color-primary-800) / <alpha-value>)", 900: "rgb(var(--color-primary-900) / <alpha-value>)", }, }, fontSize: { 0: [0, 1], xxs: ["11px", "14px"], }, fontFamily: { sans: ["Inter", "sans-serif"], }, minWidth: { sidebar: "18rem", }, spacing: { 68: "17rem", 128: "32rem", }, transitionProperty: { height: "height", width: "width", }, width: { sidebar: "18rem", }, }, }, variants: { extend: { borderColor: ["checked", "focus-within", "hover"], display: ["group-hover"], overflow: ["hover"], textColor: ["hover"], }, },};Run tailwind
Again, replace <django_project_dir> with your project directory.
npx tailwindcss -o <django_project_dir>/admin_dashboard/static/admin_dashboard/css/styles.css --watch --minifyDashboard Context
In admin_dashboard/views.py add a new function to setup the dashboard context:
def dashboard_callback(request, context): WEEKDAYS = [ "Mon", "Tue", "Wed", "Thu", "Fri", "Sat", "Sun", ]
positive = [[1, random.randrange(8, 28)] for i in range(1, 28)] negative = [[-1, -random.randrange(8, 28)] for i in range(1, 28)] average = [r[1] - random.randint(3, 5) for r in positive] performance_positive = [[1, random.randrange(8, 28)] for i in range(1, 28)] performance_negative = [[-1, -random.randrange(8, 28)] for i in range(1, 28)]
context.update( { "navigation": [ { "title": _("Dashboard"), "link": "/", "active": True }, { "title": _("Analytics"), "link": "#" }, { "title": _("Settings"), "link": "#" }, ], "filters": [ { "title": _("All"), "link": "#", "active": True }, { "title": _("New"), "link": "#", }, ], "kpi": [ { "title": "Product A Performance", "metric": "$1,234.56", "footer": mark_safe( '<strong class="text-green-600 font-medium">+3.14%</strong> progress from last week' ), "chart": json.dumps({"labels": [WEEKDAYS[day % 7] for day in range(1, 28)], "datasets": [{"data": average, "borderColor": "#9333ea"}]}), }, { "title": "Product B Performance", "metric": "$1,234.56", "footer": mark_safe( '<strong class="text-green-600 font-medium">+3.14%</strong> progress from last week' ), }, { "title": "Product C Performance", "metric": "$1,234.56", "footer": mark_safe( '<strong class="text-green-600 font-medium">+3.14%</strong> progress from last week' ), }, ], "progress": [ {"title": "Social marketing e-book", "description": " $1,234.56", "value": random.randint(10, 90)}, {"title": "Freelancing tasks", "description": " $1,234.56", "value": random.randint(10, 90)}, {"title": "Development coaching", "description": " $1,234.56", "value": random.randint(10, 90)}, {"title": "Product consulting", "description": " $1,234.56", "value": random.randint(10, 90)}, {"title": "Other income", "description": " $1,234.56", "value": random.randint(10, 90)}, ], "chart": json.dumps( { "labels": [WEEKDAYS[day % 7] for day in range(1, 28)], "datasets": [ { "label": "Example 1", "type": "line", "data": average, "backgroundColor": "#f0abfc", "borderColor": "#f0abfc", }, { "label": "Example 2", "data": positive, "backgroundColor": "#9333ea", }, { "label": "Example 3", "data": negative, "backgroundColor": "#f43f5e", }, ], } ), "performance": [ { "title": _("Last week revenue"), "metric": "$1,234.56", "footer": mark_safe( '<strong class="text-green-600 font-medium">+3.14%</strong> progress from last week' ), "chart": json.dumps({"labels": [WEEKDAYS[day % 7] for day in range(1, 28)], "datasets": [{"data": performance_positive, "borderColor": "#9333ea"}]}), }, { "title": _("Last week expenses"), "metric": "$1,234.56", "footer": mark_safe( '<strong class="text-green-600 font-medium">+3.14%</strong> progress from last week' ), "chart": json.dumps({"labels": [WEEKDAYS[day % 7] for day in range(1, 28)], "datasets": [{"data": performance_negative, "borderColor": "#f43f5e"}]}), }, ] }, )
return contextUpdate Unfold Settings
UNFOLD = { ... "DASHBOARD_CALLBACK": "admin_dashboard.views.dashboard_callback", "STYLES": [ lambda request: static("admin_dashboard/css/styles.css"), ], ...}